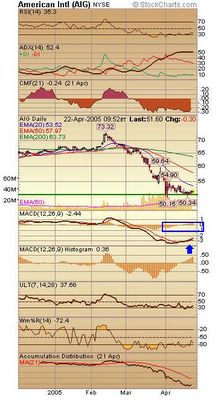
AIG 4/22/05 daily

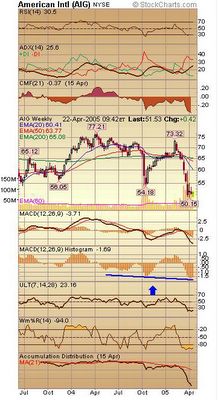
4/22/05 AIG weekly
I was looking at AIG the other day and it looked pretty interesting. The daily chart looks like a bulling divergence. The stock was making recent new lows but the MACD Hist was above the 0 line. However, the weekly chart did not show that bullish divergence. It shows a much different story. The MACD hist was making a new low! I would not buy now. I was close though.
Any thoughts?
No comments:
Post a Comment