Today was an interesting day. I kinda thought it would be. I was on the golf course, which is about right. I was looking at some charts last night and noticed Libbey (LBY). The stock looks interesting and the chart looks even better. It was up $0.69 today. I will look for an entry point, maybe tmrw.
Merck took a beating today. Down about $12. Most likely this sell off was too much. Keep an eye on the stock, could move up to adjust.
Thursday, September 30, 2004
Wednesday, September 29, 2004
9/29/2004 - Notes
A.M. NOTES
PIR - in a trading range still, showing weakness.
EPD - trending up! Started out with a bang this morning but a large sell brought it back some. I have to figure out an exit strategy for this one. I don't want to get caught up in the market hype. Maybe put on a Parabolic SAR stop.
P.M. NOTES
Nothing to report. Tmrw is the last day of the month. We will be entering the infamous month of October for the Market. There are a few stocks out there that look interesting but nothing is screaming. Remember to be patient. The Market is not a place to play around. You can do serious damage to your account if you are careless or uninformed. Wait for the stock to come to you.
Tuesday, September 28, 2004
9/28/2004 - Notes
A.M. NOTES
Nothing to add about the market. I will be adding a triple screen system to my methodology. The triple screen system basically says that you can only trade in the direction of the weekly charts. Use the daily/hourly charts for your entry.
My methodology is set now. I don't want to keep fiddling around with it. You can turn a good system in a crappy one by trying to make it "perfect." No system will be perfect. Good money management is essential due to the imperfections of a system. Lastly, you need discipline.
In summary:
1) good system
2) tight money management
3) discipline
P.M. NOTES
EPD - still moving up. Not much overhead resistance here and there ia a 7% div. Let this one run.
PIR- down today at $17.85. stop is at $16.33.
Monday, September 27, 2004
9/27/2004 - Notes
A.M. NOTES
Looks like the market is heading lower this morning. Nothing to add now. Keeping an eye on all stops (PIR & EPD). Also looking at potential ideas (CL, KO, MO).
P.M. NOTES
EPD - stock is trending higher. One of those quiet stocks that seems to move up steadily each week. If this stock continues to perform this way it may be wise to put on a Parabolic SAR stop. Too early to tell.
PIR - down today. Definitely showing weakness for the past week. If the stock moves below its trading range the protective stops will be tightened.
Friday, September 24, 2004
9/24/2004 - Notes
A.M. NOTES
Nothing to add. Keeping an eye on all holdings.
P.M. NOTES
EPD - On the daily chart EPD is in a strong uptrend. On the weekly, this stock is just starting to show strength. Volume is increasing too. Bulls appear to be in charge. Hold.
PIR - Showing some weakness on both daily and weekly charts. Looks like some instituions are stepping in to add support on downturns. Hold.
Thursday, September 23, 2004
9/23/2004 - Notes
A.M. NOTES
SAY - stopped out, no longer holding
EPD - still waiting
PIR - Still waiting
P.M. NOTES
PIR - stop is at $16.33. Trading range $17.00 to $18.60. The EMAs are flat or trending up.
EPD - stop is at $18.67. Trading range $22.00 to $22.50. The EMAs are flat or trending up too.
OK, like I said in the AM NOTES, I am still waiting for EPD and PIR to trend up. Don't forget that EPD has a div. yield of About 7%.
advice: hold tight..

a story about foxes
Someone asked me what the Market was going to do the other day.
I replied, "I don't know. I am not smart enough to predict the Market. I just follow where the group is going."
The person said to me, "Oh, so you are a sheep!?"
I was a little taken aback by the comment but said, "Yeah, I guess."
Later in the day I was thinking about my dialogue with the person and became concerned. Hey, I don't want to be a sheep, they usually get slaughtered at the end of the story. No? Also, that is not really my whole investing philosophy. True, I follow the trend. I don't decide what or when or how long the trend will last. I get in and get out. My number one priority is DON"T GET SLAUGHTERED!
So, if I could go back to the conversation that I was having with the person, I would say, "Well, I may look like a sheep but I am not one. Come here and take a closer look. See my teeth. See the blood stains? Feel my fur. Its not wooly. Is it? I am actually a fox disguised as a sheep. Pretty sneaky huh?"
I would like to make a change to the old Wall Street adage about Bulls, Bears, Sheep and Pigs. Lets add Foxes to the group, but don't tell anyone...
As ever,
JWK
After some thought, lets cut the BS. If I am going into the capital markets, I would rather be a shark. They are quick, efficient and kill their prey.
Wednesday, September 22, 2004
SAY (NYSE) 9/22/2004 Sold $23.05

SAY (NYSE) 9/22/2004 Sold $23.05
Here is the chart that shows where the stop happened. All indicators are down, volume is also trending down, which does concern me. I am not smart enough to blaze trails in the Capital Markets, so I just follow others.
9/22/2004 - Notes
A.M. NOTES
SAY - Stop is set to $23.05 today. Whole market is off this morning.
P.M. NOTES
SAY - Well, I got stopped out of SAY today at $23.05 using the Parabolic SAR stop. The stock had a pretty good run up over the last few weeks. I was surprised that SAY moved as hard as it did today. All indicators turned down. I am always concerned that I may have left some money on the table but there is no getting around that feeling in this business. In order to keep alive in this business you need your capital. Mission accomplished.
Tuesday, September 21, 2004
9/21/2004 - Notes
A.M. NOTES
SAY - The stock was up yesterday, the stock came out of the gates fast this AM too. The Parabolic stop has been moved up to $22.89. The activity this morning looked like institutions buying in some huge blocks. The volume charts looked impressive.
P.M. NOTES
The MACD is basically a refinement of the two moving averages system and measures the distance between the two moving average lines. Signals are taken when MACD crosses its signal line, calculated as a 9 day exponential moving average of MACD.
The indicator is primarily used to trade trends and should not be used in a ranging market.
First check whether price is trending. If MACD is flat or stays close to the zero line, the market is ranging and signals are unreliable.
Signals are far stronger if there is a large swing above or below the zero line. Flat MACD signals that the market is ranging - we are more likely to be whipsawed in/out of our position.
SAY - up today +$0.52. Day started off strong and then pulled back a bit. EMA all trending up. Stock had some selling pressure at the end of the day. The stop will be adjusted tomorrow.
Monday, September 20, 2004
9/20/2004 - Notes
A.M. NOTES
Today, I am keeping a close eye on SAY. The Parabolic SAR will be adjusted again. The stop price is moved up to $22.52. Stay tuned...
P.M. NOTES
PIR - stock is in a trading range of ~ $16.90 - $18.73, 20 and 50 Day EMA are trending up, current price is $18.62. Keep holding PIR, this was a Buffett idea so keep long-term prospective.
EPD - stock is in a trading range of ~ $22.03 - $22.40, 20-50-200 Day EMA all trending up. Volume trending up too. This stock also boasts a 6.71% Div yield. Continue holding this stock for long term appreciation.
SAY - up today so the stop was not used. There are some institutions taking some profits, causing some selling pressure. Bulls are still winning the battle though. The stop will be put on tomorrow.
Football vs. Trading

Bill Belichik
You probably don't think this posting has anything to do with trading but give me a chance. During a football game, generally each team is just trying to get to their first down. Nothing fancy, maybe some short passes or using the running back. However, every once in a while you see the QB make a huge play and an exciting play turns into a touchdown. I see many similarities between football and trading.
1). Don't lose your field position.
2). Don't force any fancy play that could risk the game.
3). Move the ball forward.
4). Secure the win.
I know this is a crude analysis but valid nonetheless.
Saturday, September 18, 2004
9/18/2004 - Market Thoughts
Satyam has started to make its move, although the stock was down $0.83 on Friday. I don't think the move down is anything to worry about. Yet. The Parabolic SAR stop will still be put on next week. The ADX shows strength but the +D line is moving down. So we will keep an eye on that signal. Otherwise all systems go.
I am keeping an eye on Coke and Dean Foods. These companies have been sold off pretty good. I will check their action on Monday to see where we stand.
I am keeping an eye on Coke and Dean Foods. These companies have been sold off pretty good. I will check their action on Monday to see where we stand.
Thursday, September 16, 2004
SAY (NYSE) update

SAY (NYSE) 9/16/2004
Hello friends, as usual it has been a while since I last published. I have been looking at SAY and this stock is in a confirmed uptrend which started around Sept 1. We have been waiting for this to happen for quite sometime. Lets review some of the technical indicators:
RSI (14) is at 77.0. The RSI compares the magnitude of a stock's recent gains to the magnitude of its recent losses and turns that information into a number that ranges from 0 to 100. It takes a single parameter, the number of time periods to use in the calculation. Generally, if the RSI rises above 30 it is considered bullish for the underlying stock. Conversely, if the RSI falls below 70, it is a bearish signal. Some traders identify the long-term trend and then use extreme readings for entry points. If the long-term trend is bullish, then oversold readings could mark potential entry points.
ADX (14) is at 39.1. In looking at the chart you can see that the SAY is in a trend and the trend is STRONG.
ADX is an oscillator that fluctuates between 0 and 100. Even though the scale is from 0 to 100, readings above 60 are relatively rare. Low readings, below 20, indicate a weak trend and high readings, above 40, indicate a strong trend. The indicator does not grade the trend as bullish or bearish, but merely assesses the strength of the current trend. A reading above 40 can indicate a strong downtrend as well as a strong uptrend. +DI measures the force of the up moves and -DI measures the force of the down moves over a set period.
ADX can also be used to identify potential changes in a market from trending to non-trending. When ADX begins to strengthen from below 20 and/or moves above 20, it is a sign that the trading range is ending and a trend could be developing.
As a simple rule of thumb, "When the +DI line is above the -DI line, all Parabolic sell signals can be ignored."
OK, SAY is in a confirmed strong uptrend. Thus, I feel good about putting on a Parabolic SAR stop. The stop is place at $21.55. 9/16/2004 This stop will be adjusted each day.
Parabolic SAR stop at $22.08. 9/17/2004
Wednesday, September 08, 2004
Where are we?

Date: 9/08/2004
I am always curious where we are in the Market. I took this from StockCharts.com. I hope I don't get in trouble. Based on Sam Stovall's S&P Guide to Sector Rotation, we are at the top of the Market cycle. I am not selling all my holdings just yet. My gut instinct is that the Middle East and Venezuela problems have had much to do with the increase in energy stocks. I am sure you have figured that out too. I took a look at the Dow Avg. stocks today and I don't see any huge steals out there (based on technicals), maybe INTC.
Tuesday, September 07, 2004
MEMC Electronics - I got killed...
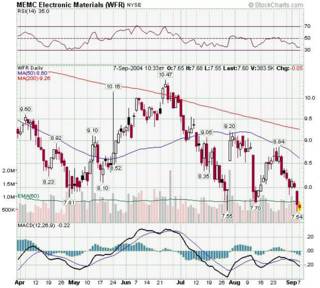
MEMC Electronic (WFR - NYSE)
It has been awhile since my last journal entry. I try not to write when I don’t have anything to say. I guess that is good and bad. Good because I will not waste your time. It is bad because I should have commentary about the Market that does not waste your time. Something to work on I guess…
Let me first say that PIR and EPD have done well thus far. PIR is up about 2% and EPD is up about 10% from the buy price. There is one stock, however, that I bought a while back that has not done well. MEMC Electronic (WFR) was bought after reading a favorable article in Barron’s magazine. Scott Black, a very smart guy, who runs Delphi Management in Boston, loaded up on this stock himself. I have made thousands of dollars on Scott’s advice. Not this time. I took a 26% haircut. I did not follow the 8% rule.
MEMC Electronic Materials, Inc. is engaged in the production of wafers for the semiconductor industry. The Company provides wafers in sizes ranging from 100 millimeters to 300 millimeters and in three categories: prime polished, a highly refined, pure wafer with an ultra-flat and ultra-clean surface; epitaxial, a think, silicon layer grown on the polished surface of the wafer and test/monitor, which is substantially the same as a prime polished wafer, but with some less rigorous specifications. The Company's wafers are used as a starting material for the manufacture of various types of semiconductor devices, including microprocessor, memory, logic and power devices. In turn, these semiconductor devices are used in computers, cellular phones and other mobile electronic devices, automobiles and other products. Its principal customers are semiconductor device manufacturers, including memory, microprocessor and applications specific integrated circuit manufacturers, as well as foundries.
It did not help that the Semiconductor Equipment Industry is ranked last in terms of performance. I know EMEC will come back. I don’t know when or the magnitude.
I bought WFR around $10. The stock pierced the 200 MA and I held on. The stock pierced the 50 MA and I held on. So, now I finally decide to sell. I have to study this chart so I don’t make the same mistake twice!
Subscribe to:
Posts (Atom)