Monday, January 29, 2007

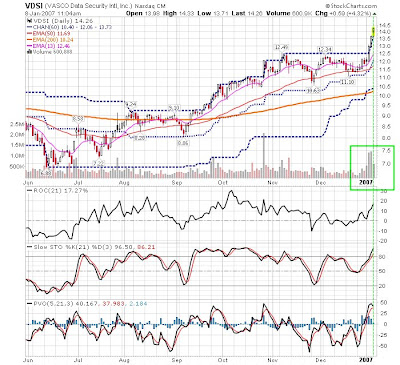
VDSI / HMSY


I continue to hold VDSI in my 401(k). The stock look solid still. It is stabilizing after its last run up.

Another stock that looks interesting is HMSY. The stock, much like VDSI has been going through a basing pattern after its last move up. Today the stock moved higher. I do not own HMSY.

Friday, January 26, 2007

How Many Stocks to Watch?

  • Pick only 1 or 2 issues to watch. You are more likely to do better by following a few stocks well than following a bunch of stocks poorly.
  • Use both physical stops and limit orders to control risk.
  • Successful swing trading requires little knowledge about the companies underlying fundamentals.

Wednesday, January 24, 2007

VDSI

Like I said, I sold VDSI in the trading account and held it in the 401(k). I bought VDSI during wide price bar action, which is risky. I should have waited for the stock to "cool" before purchasing.

Monday, January 22, 2007

Expansion - Contraction

  • Price bars tend to expand during rallies and sell offs.
  • Then congestion sets in.
  • Volume drops and price bars narrow. (I know - the Empty Zone!)
  • Then, pressure builds up and the price starts moving again. (Positive feedback)

Sold VDSI in Trading Account - holding in LT Account

I sold VDSI in my Trading account today at $14.10. However, I am still holding the issue in my 401 (k) account. Technically, this issue is not something you want to be holding long. I thought the stock may find support around its 13 day MA but no such luck. I am guessing the stock will bounce around $13.50 to $14.75. I think the market is now waiting for the Jan. 31st conference call.

Trend/Range

  • Positive feedback tends to surge in waves.
  • Negative feedback allows the trader to enter a low risk position.
  • Enter positions when the range nears primary S/R and watch for momentum in the next lower time frame to carry the trade to a profit.

Bollinger Bands

A good tool to measure central tendency of price.
  • Enter fade positions when price hits the top or bottom band.
  • Look for bands to tighten around dull markets.
  • Consider shorting when the price pops more than 50% out of the top band and go long if this occurs on the bottom band.
  • Odds favor price falling all the way to the bottom band when the central pivot breaks.

Sunday, January 21, 2007

Moving Average Ribbons (MARs)

Expect choppy price action during phases when the averages criss-cross out of sequence. Price can bounce around like a pinball several times before breaking free when it gets caught between inverting averages.

MARs allow quick examination to locate classic retracement levels to use for entries on the next pullback.

3D Charting

I am most comfortable operating as a position trader. That being said, if I were to develop a 3D system, I would look at the 60-minute/daily/weekly charts.

Also:
  • Logarithmic vs. Linear Charts: Use logarithmic for low price or volatile stocks. Use linear for higher-priced or slower moving stocks.
  • Always look at the price bars first. Use the "lower pane" indicators to support what you see in the chart. Not the other way around.

Cross-Verification

Focus trade preparation on cross-verification to locate promising setups and measure risk:reward. Basically from what I can gather, is that cross-verification is an area on a chart where there are multiple trade signals at a certain price. This price is low risk entry point. They key is to uncover this area and execute a trade.
  • Look for price close to substantial support to identify low-risk long trades.
  • Look for price close to substantial resistance to find low-risk short sales.
  • Measure profit targets (PT) and failure targets (FT).

Saturday, January 20, 2007

Support & Resistance

  • Look for price to fail the first test of any significant high or low horizontal level. But expect a successful violation on the next try.
  • Rising or falling moving averages routinely mark significant boundaries.
  • Trend line and channel breaks signal the end of a prior trend and the beginning of a sideways phase.
  • Use central tendency to uncover ripe trading conditions but then shift to other indicators to identify low-risk entry levels and proper timing.
  • Try using Fibonacci to see how far a rally or decline will likely pull back before reversing.
  • Corrections routinely retrace at least 1/3 to 1/2 before support begins a new rally phase. Many trends pull back 2/3 before changing direction.
  • Round numbers affect trends. 10,20,25,30,35,100,10000.

Entry

From Alan Farley
  • Classic swing traders work best during negative feedback.
  • Enter positions at low risk and exit them at high risk.
  • These areas often mean buying support and selling resistance.

frozen

I am really curious about what happened on Friday concerning VDSI's drop in price. I could not find any news to base the drop on. Message boards were useless, as usual. My initial thought was that it will come back in the afternoon. Then I thought, I will sell now and buy back cheaper. However, anytime I tried doing that in the past the stock would bounce up after I sold. So, with no real evidence about anything, I am holding on. I know this does not sound like a good game plan but I hate churning a portfolio. I am watching it closely though.

Friday, January 19, 2007

oh nelly

What happened to VDSI this AM? What was it? Some type of gunning exercise or something? I am sitting tight. I don't know if that is the right thing to do but I want to see what happens in the afternoon.

Thursday, January 18, 2007

You can't rest in any market

Well, today more news comes out that shakes the market. One day everything is good. The next day, it is time worry about something else. Get used to it if you plan to stay in this business.

Anyway, I was looking at a few interesting stocks tonight. I found: ROCM, JSDA, CTEC.

Otherwise, I have not made any new buys or sells. I continue holding VDSI.

Trend Relativity

  • The most profitable positions will align to support-resistance on the chart above the trade and display low-risk entry points on the chart below.
  • The perfect set-up rarely exists.
  • Many traders make the mistake of seeing their trade in one time frame and executing in another.
  • Decide how many bars must pass before a trade will be abandoned regardless of gain or loss.

Time

I remember when I read Alex Elder's books and he introduced me to the Triple-Screen system. Well, Alan Farley explains the same idea.
  • First, choose a primary screen that reflects the holding period and matching strategy.
  • Second, study the chart one time frame above your primary screen. This chart should identify support/resistance and other landscape features.
  • Third, shift down one time frame and look for a low risk entry point.

Some traders, sit on nonperforming positions for weeks and tie up important capital while other opportunities pass them by.

Here is an interesting concept about time. Use both price and time triggers for stop loss management. Time should activate exits on nonperforming trades even when price stops have not been hit.

Alan Farley - Swing vs. Momentum

  • Price seeks equilibrium.
  • Swing trades that execute right near support or resistance offer good opportunities. At its core, the narrow swing tactic buys at support and sells at resistance through congested markets. It fades the short-term direction as it predicts that a barrier (resistance/support) will hold and reverse price.

Wednesday, January 17, 2007

Alan Farley - Trend Range Axis

Alan talks about trend range axis. Also, I think Alan has some good things to say but his language is very difficult to understand sometimes. He tries to make ideas sound more difficult than need be. Once you get used to the way he expresses himself, the information he provides is good.

Stocks are either trending or trading within a range. Alan refers to this as positive (trending) or negative feedback (range bound).

Basically, you have these cycles where there are periods of quiet low volume trading where price absorbs volatility. Once that has happened, another leg of activity erupts.

Alan says, when breakouts erupt, follow the instincts of the momentum player. Buy high and sell higher. However, when volume drops and price bars narrow, use price boundaries (ranges) to fade the short-term direction.

Some Ideas

During my evening scan, I notice a couple interesting ideas. I am looking into ANGN,SIMO, WIT and PSO.

I was surprised to see VDSI move up as much as it did. I actually do not prefer frenzied action on the tape. Too risky and too much emotion. As long as the institutions are Bullish, we should see an upward bias. Try not to get shaken out by the volatility if you can help it.

VDSI - Still holding

Still holding onto VDSI. Obviously, stocks are going to go up and down. It is important to realize thet there is an upward bias now for VDSI. There is still buying pressure, which is what we like to see. So, hold tight and lets keep our eye on the trend!

Sunday, January 14, 2007

Alan Farley - Pattern Cycles

I have been looking at Alan Farley's Book, The Master Swing Trader, and trying to glean some information about trading (successfully!). Anyway, Alan starts out by explaining pattern cycles.

  • Pattern Cycles recognize that markets travel through repeated bull and bear conditions in all time frames.
  • As ranges contract, so does volatility. Like a coiled spring, markets approach neutral points from which momentum reawakens to trigger directional price movement. This area between the end of an inactive period and the start of a new surge marks a high-reward empty zone (EZ) for those who can find it.
  • Price bar range (distance between high and low) tends to narrow as markets approach stability.
  • Once located, Place an execution order on both sides of of the EZ and enter a position in whatever direction the market breaks out.

Sounds pretty easy but there has to be more to this than meets the eye. I can't wait to find out! I just look at a bunch of charts and the EZ in not easy to see. It rarely will jump out at you. What I did notice is that you do see waves of motion in prices. The waves in a strong trend seem to offer the best opportunity. Look at the charts below. I picked the out of the S&P 500. The first few I looked at.

Friday, January 12, 2007

The Discipline Trader - more notes

I have been reading more of The Disciplined Trader by Mark Douglas. I like the book. I think people who want to become better in the Markets think that there is a magic formula. This book addresses that "touchy feely" side of trading. I think most people can understand the "rules" of trading. Few people can manage their emotions though when they are in the Market. So here are a few more ideas from the book.

  • Prices will go in the direction of the greatest force. (Elder's Force Index could be useful to gauge the strength.)
  • If you never really know where the market may stop, it is very easy to believe there are no limits to how much you can make on any given trade.
  • Get over the notion that each trade has the potential to fulfill all your dreams.
  • Once you put on a trade, you have to actively participate to end your losses.
  • You have to learn how to read the market. It will tell you what to do.
  • In an unstructured and unlimited environment, it is essential that you establish rules to guide your behavior.

Evening Notes

The Market was up but the stocks I was looking at all finished down. I think it may have been benign profit taking. I mean, VDSI has been moving up fast and can't sustain that movement without some retreat.

I bought some more VDSI for my 401(k). I paid 15.49.

I did a little work after the Market closed but I did not see anything too interesting. I will do some more work this weekend.

Thursday, January 11, 2007

Evening Notes

Today was another good day on the Street. I have been looking at a few ideas: ccoi,vocs,hmsy,mend,sncr,nite,smod,meh. In particular, hmsy is looking very interesting!

I am still holding VDSI. Today's action on VDSI looked good. The bulls won today and the volume looked nice. So, lets sit tight for now.

The Exhaustion Gap ---------

  • These gaps can be confused as a Runaway Gap.
  • Look for high volume.
  • These gaps are quickly filled.
  • A big clue is a gravestone doji candle or something resembling that idea where the Bulls could not close the stock on the high side of the daily range.

The Runaway Gap ----

So far we have dicussed the common gap and breakaway gap. Lets talk about the Runaway Gap!


  • The main difference between a Breakaway and a Runaway is that the Breakaway happens after a consolidation or established trading range. The Runaway happens during an upward trend.

  • Look for significant volume during and after the Runaway gap.

  • The term Measuring Gap is also used to describe the Runaway Gap. The idea that the Measuring Gap will occur at the mid-point of the move.

Still going

VDSI is still moving north from the Breakaway Gap we saw a few trading day back. You have to remind yourself that this is not your answer to your dreams. Stocks don't go north forever. So, keep an eye on it and get ready to leave the game and start a new one. It is up to you to decide when the "game" is over.

Wednesday, January 10, 2007

The Breakaway Gap - fun and exciting!!!!!

VDSI - now that looks like a Breakaway Gap.


  • The price is breaking out of their trading range or congestion area. (different from Runaway Gap, which we will discuss later)
  • Volume will pick up, not only for the long buys but also the shorts covering their positions.
  • The volume should occur when the gap appears, not before, to ensure a chance of further advancement.
  • The gap is now the new line of support for long breakouts and resistance for shorts.
  • Don't wait for the gap to be filled to put on your position. You could miss a good upside move in this situation.

more gap analysis, the common gap

Yesterday, I started talking about gaps. There are four kinds of gaps out there. Lets go over the common gap aka: trading gap or area gap.

  • The common gap is usually uneventful. A stock going ex-dividend could cause this. These types of gaps are "common" and will fill quickly.


  • What does filled mean? The price, after the gap event, will go below the area of the gap.


  • These gaps also show avg or low volume.
  • These gaps are good but don't expect great trading opportunities to come from them.


Tuesday, January 09, 2007

interesting stock ideas

I looked at a few stocks after the markets closed. These look interesting for long positions. AOB,HLTH,HMSY,MENT,VDSI.

the gap with VDSI

VDSI was down today $.34. I am not surprised due to the big run-up this thing has had. There was a gap yesterday that did not get filled today. Lets talk a little about gaps.
  1. It is always Bullish when a stock gaps higher.
  2. After the up gap, many traders want to sell and take profits.
  3. A new high after a round of profit taking, indicates that buyers are not waiting for a pull back to get in.
  4. If the price falls below the gap, be patient (don't buy the gap).

Today's Opening Notes

random readings:

  • Stick to the best stocks, while looking for optimal buy points to start to a position or add to one. Avoid buying laggards that are late to the party.
  • oil prices slipped again. February crude dipped 22 cents to $56.09 a barrel, reversing after early gains. Warm winter weather in the Northeast and ample supply have fueled a drop of nearly 9% in oil prices over the past week. Energy stocks, which led the market in the first half of 2006, have mostly fizzled since then, with oil prices about 40% off summer's peak levels.

Monday, January 08, 2007

The Disciplined Trader (TDT)

I started reading The Disciplined Trader by Mark Douglas. Here are some interesting notes that I took:
  • Traders that have been successful state that they did not become that way until they learned self-discipline, emotional control, and the ability to change their minds to flow with the markets.
  • Don't expect to become a successful trader if you have limited capital or if you are trading with money you can't lose.
  • Don't be affected by the "big trade" mentality. (take small wins)
  • None of us has the mental capacity to be aware of everything going on in the environment at once.
  • The more I followed my rules the more I trusted myself.
  • It is critical to have an organized, systematic, step by step approach to learn the mental skills necessary to accumulate wealth as a trader.
  • Trading systems limit the scope of market behavior, and therefore make this activity a little easier for our minds to manage.
  • The trading arena is never ending, that begins only when one decides to participate, that ends only when one has had enough.

INTC sold at $21.11


I sold INTC today at $21.11. This stock could be dead money for a while. I thought this stock was poised to a good move but I have held it for a while and it does not know which direction to go in. I got out with a small profit. Lets wait for a trend to start and revisit.

VDSI bot at 13.92


I bought some VDSI today at $13.92. Here is a great example stocks moving on emotion. Lets face it, all stocks do.

So, my stop is around $13.64. Again, volume will be important to keep this sucker moving upward.

Sunday, January 07, 2007

VDSI


It will be interesting to see what VDSI does tomorrow. Technically, this stock has a lot going for it. I would think there would be a little pullback so that some us can get in and ride this one. What really catches my eye is the larger volume in the past couple trading days. Also, the stock has been closing at or near its daily high.

Friday, January 05, 2007

not much of anything

The stocks I mentioned today did not do a whole lot. OK with me, it is nice to document your thoughts and see the outcome. I have a friend who comes up with all these different ideas. The ideas are somewhat obvious and good because the Market is on to them already. Once the trend changes and goes south, I ask my friend how he did. The usual response is, "Oh I got out of that a week ago..." This kid should have worked for Soros. Anyway, my point is, if you do not document your thought and actions in the Market you will only remember the winning ideas and think you can do no wrong.


I picked up The Disciplined Trader by Mark Douglas to read. I will let you know how it reads. It has been recommended on some websites; I can't wait to start reading.


Telecom

We all know that Telecom has done great during the last half of 2006. I was looking at a few charts last night and these stocks like pretty interesting still. KPN and TEO have great looking charts and solid trends in place.

Thursday, January 04, 2007

Intel ? Crazy now.


I picked up some Intel about two months ago based on the facts that it was in the middle of a upward trend. The stock ended up going down somewhat but today she popped up a little. Over the weekend one reporter said maybe INTC is the dark horse for 2007. It did nothing in 2006 and has only upside potential. We have heard that before. Anyway, still holding on...